Business Context
In a digital-first sports economy, fan engagement across platforms like YouTube serves as a leading indicator of audience growth, content performance, and brand momentum. However, social engagement data is high-volume, time-sensitive, and subject to API instability, making manual analysis unreliable at scale.
This project treats YouTube engagement data as a production analytics input, requiring automated ingestion, standardized transformations, and validation before it reaches reporting.
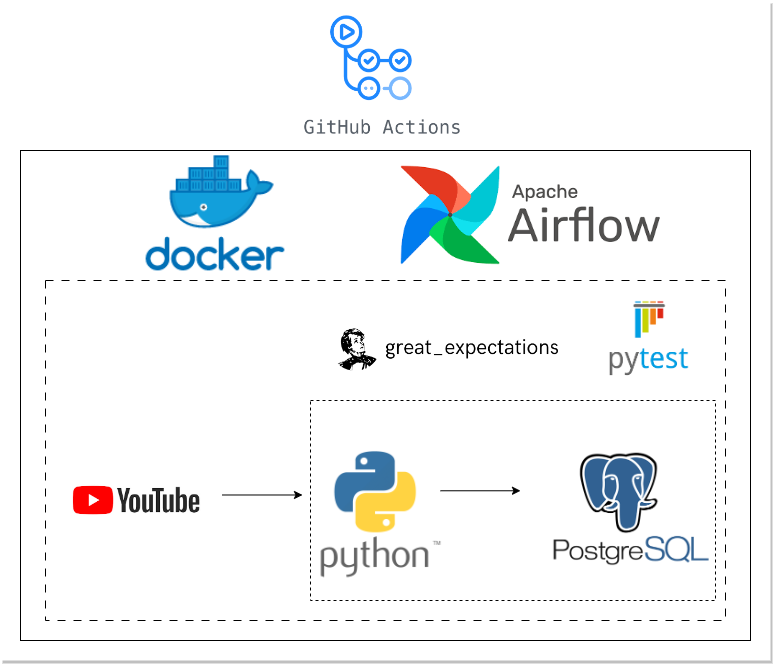
Architecture Overview
High-level view of the YouTube API analytics pipeline, from ingestion through validation and BI consumption.
Problem
Ad-hoc API pulls and manually maintained dashboards introduce silent metric drift, inconsistent time-series comparisons, and low confidence in analytics.
- Unreliable engagement trends due to inconsistent ingestion
- Schema and metadata volatility from the YouTube API
- No automated validation of pipeline outputs
- Fragile reporting dependent on manual refreshes
Solution
Designed and implemented a lightweight but production-oriented analytics pipeline that automates ingestion, enforces data quality checks, and exposes standardized engagement metrics for BI consumption.
Tooling
- Python for API ingestion, orchestration, and transformations
- YouTube Data API as the upstream data source
- PostgreSQL for raw, staging, and analytics tables
- SQL for modeling and metric standardization
- Power BI for reporting and trend analysis
Implementation Approach
1) Automated API Ingestion
Built Python scripts to ingest video-level engagement metrics (views, likes, comments, publish timestamps) on a repeatable schedule.
Raw Metrics:
- video_id
- channel_id
- published_at
- view_count
- like_count
- comment_count
- last_collected_timestamp
2) Data Modeling & Standardization
Transformed raw API responses into standardized analytical tables, enabling consistent time-series analysis and cross-video comparisons.
3) Data Quality & Pipeline Validation
Implemented basic data quality checks to validate schema consistency, null thresholds, and record freshness before metrics were exposed to BI.
- Row count and freshness validation
- Null and type checks on key engagement fields
- Guardrails against partial or failed API pulls
4) BI-Ready Reporting Layer
Exposed modeled engagement data to Power BI, enabling reliable reporting on content performance, posting cadence, and engagement trends over time.
Impact
- Improved metric reliability: standardized engagement data with reduced drift
- Reduced manual effort: eliminated ad-hoc API pulls and spreadsheet workflows
- Scalable foundation: pipeline structured to support additional platforms and metrics
- Analytics confidence: enabled consistent, repeatable reporting for decision-making